To manage a budget & reach sales objectives, the Head of Demand Generation must run pipeline math in three ways.
Forward math >> How much revenue will Y media spend drive?
Reverse math >> How much media spend is needed to drive X revenue?
What-Ifs >>What is the impact of changing the performance of any (or all) of the performance metrics?
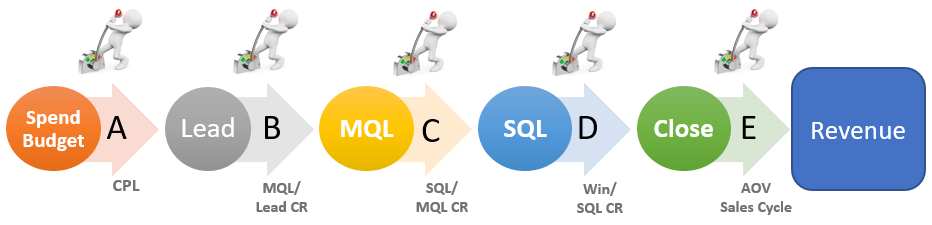
First, define each stage of the buying process:
Visitor - No Contact Information Provided
Lead - Have Contact Information
MQL - Some Engagement with Content
SQL - Enriched Data & Active Engagement with Content
Close/Win - Contract Signed
Next, define the effectable levers :
Cost-per-Lead (CPL) - Cost to create awareness & have the customer enter an email address. The customer must align with your ICP (Ideal Customer Profile).
Use $18 as a placeholder if yours is unknown (Assumes visitor → Lead CR is 1.4% and average CPC is $0.25). Use $22.50 if just starting out.
Lead → MQL CR - Some Leads are one-and-done, others continue to engage (Clicking ads, opening emails, etc…) and become MQL opportunities.
37% is the B2B SaaS Industry average. Use 30% in initial modelling (You'll optimize over time).
MQL → SQL CR - MQLs get enriched within the CRM. Push low opp. MQLs to a self-serve stream & high opp.y MQLs move to SQL and sales engages.
39% is the B2B SaaS Industry average. Use 31% in initial modelling (You'll optimize over time).
SQL → Win CR - Self-explanatory.
15% is the B2B SaaS Industry average. Use 12% in initial modelling (You'll optimize over time).
AOV & Sales Cycle - Self-explanatory.
Now Run The Math!
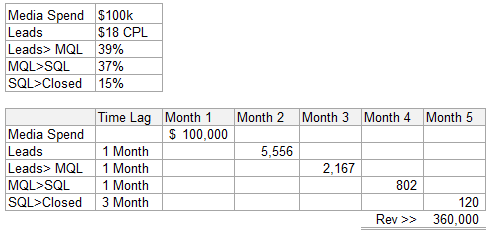
Forward math >> How much revenue will $100,000 media spend drive?
The formula: (Media Spend ÷ CPL) x MQL/Lead CR x SQL/MQL CR x Close/SQL CR x AOV = Revenue
Assumptions: Media Spend is set at $100,000 and AOV is $3,000
The math:
High-End - ($100,000 ÷ $18) x .39 x .37 x .15 x $3,000 = $360,000.
Low-End - ($100,000 ÷ $22.50) x .31 x .30 x .12 x $3,000 = $148,800.
Sales Cycle: Set this up in a spreadsheet and offset stages as follows:
Conclusion: $100k spend today will net $148k to $360k in revenue 5 months from now.
Reverse math >> How much media spend is needed to drive $200,000 in revenue?
The formula: Media Spend = (Revenue x CPL) ÷ (MQL/Lead CR x SQL/MQL CR x Close/SQL CR x AOV)
Assumptions: Revenue needed is $200,00 and AOV is $3,000
The math:
High-Performance - Media Spend Needed = ($200,000 x $18) ÷ (.37 x .39 x .15 x $3,000) = $55,440
Low-Performance - Media Spend Needed = ($200,000 x $22.50) ÷ (.30 x .31 x .12 x $3,000) = $134,409
Conclusion: You'll likely have to spend $55k to $134k, when first starting out, to generate $200k in revenue.
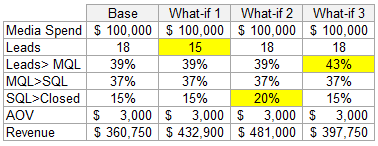
What is the impact of changing the performance of any (or all) of the performance metrics?
Create a simple table in excel as follows. Change 1-2 variables & quantify the impact on revenue.
Leverage the ICE Scoring Model (Impact / Confidence / Ease) to decide what metric to target for improvement: